Exploring Innovations in GIS and Visualization for Healthier Communities
November 23, 2020
Integrating Environmental Health and Healthcare Data
In addressing COVID-19, many health agencies have explored how tools and technologies can augment their traditional public health work to include the strategic and effective use of data for better decision making. One such tool is Geographic Information Systems (GIS), “a computer-based tool that examines spatial relationships, patterns, and trends” and can supplement, expand, or improve state and territorial health agencies’ (S/THAs) public health surveillance activities. This brief includes several GIS and mapping innovations as well as original research conducted by ASTHO staff to better understand the value of GIS in mapping national public health emergencies and strengthening public health practice by linking environmental health and healthcare data.
How Public-Private Partnerships Increase GIS Capacity Across Health Agencies During COVID-19
Esri, a private GIS technology company, collaborated with CDC to help states create and enhance map-based COVID-19 dashboards using GIS to visualize data from sources including labs, testing sites, vital records, healthcare providers, and other public health information systems that are pertinent for the response. Discussions between states, CDC, and Esri resulted in leveraging promising practices for displaying critical information including number of cases, deaths, tests, and hospitalizations. Dashboards mapped out trends, included outbreak information, and analyzed data by racial/ethnic groups. Presenting this information in a visual manner can help increase the public’s understanding and use of said data, especially with regard to spatial relationships.
Using Census Block Group Data To Identify Relationships Between the Environment and Public Health
The Wisconsin Department of Health Services (WIDHS) recognized the benefit of using GIS to map hospitalization and emergency room discharge data to determine what impact freeway traffic had on patients with asthma. WIDHS partnered with their state hospital association to support a statutory change that allowed for the reporting of health data at the census block group level. This change will allow WIDHS to better evaluate the potential environmental risk factors for asthma emergency room visits and hospitalizations, such as patient proximity to major roadways. In addition, this application of GIS establishes pathways for new understanding where academics and scientists can develop more detailed empirical questions or research projects to establish statistically significant relationships between the environment and health outcomes.
Utilizing Mapping Technology in Public Health Practice
Environmental data elements used in GIS analyses can be leveraged in concert with electronic health records (EHRs) to inform how location-based factors influence one’s health. To explore this further, ASTHO conducted a literature review in 2019 to better understand how GIS or other mapping technologies could be applied to both environmental data and electronic health information to improve state and territorial health agencies’ environmental health surveillance practice. One innovation includes MAPSCorps, a nonprofit formed from a collaboration between the University of Chicago, South Side of Chicago community groups, and youth workforce programs. MAPSCorps conducts an annual community resource census using smartphones and open source technology through the MapApp application. Data from the application is then uploaded to the CommunityRx system. Local providers’ EHR platforms are then linked with the CommunityRx system and at the conclusion of each clinical visit, data from a patient’s EHR is automatically sent using secure methods to the CommunityRx system to generate a HealtheRx, or “personalized [list] of community resources” for a patient based on their location.
Another innovation, adopted by the Children’s Hospital of Philadelphia, integrates Esri ArcGIS software into their Epic EHR system so that map visualizations can be displayed to include the specific patient’s data compared to the hospital's overall patient population’s disease conditions by geographic region, age, and race/ethnicity. Health agencies can reference these examples when exploring data partnerships with their state or territory’s academic institutions, medical centers, or healthcare providers.
ASTHO Primary Research Findings
 ASTHO explored the use of GIS to connect environmental health and electronic health information by conducting market research, a systematic literature review, and data collection/reporting. When exploring the literature, ASTHO found examples of how electronic health information was integrated within a GIS, how GIS platforms could be embedded within EHRs, and other innovations that use GIS to overlay electronic health information with other data sources (e.g., social services data, environmental data).
ASTHO also analyzed data from the environmental health informatics section of the 2019 State and Territorial Environmental Health Programs and Services Survey, a comprehensive survey completed by members of ASTHO’s State Environmental Health Directors Peer Group, and found the following:1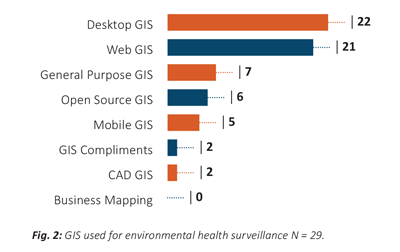
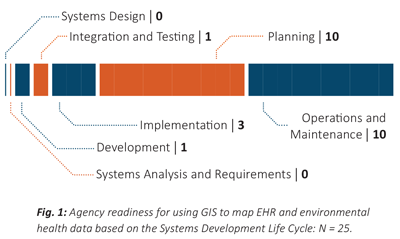
- Agency readiness for using GIS to map EHR and environmental health data is assessed through the Systems Development Life Cycle (SDLC), a process that applies to information system development and integration projects to meet agencies’ strategic goals. Data show capacity at both ends of the lifecycle with nearly half still in the planning stage and half in the operations and maintenance stage (Fig. 1).
- Findings show that a majority of agencies are using desktop and web-based GIS (Fig. 2). Web GIS is best for a broad array of users, whereas desktop GIS is best for trained professionals.
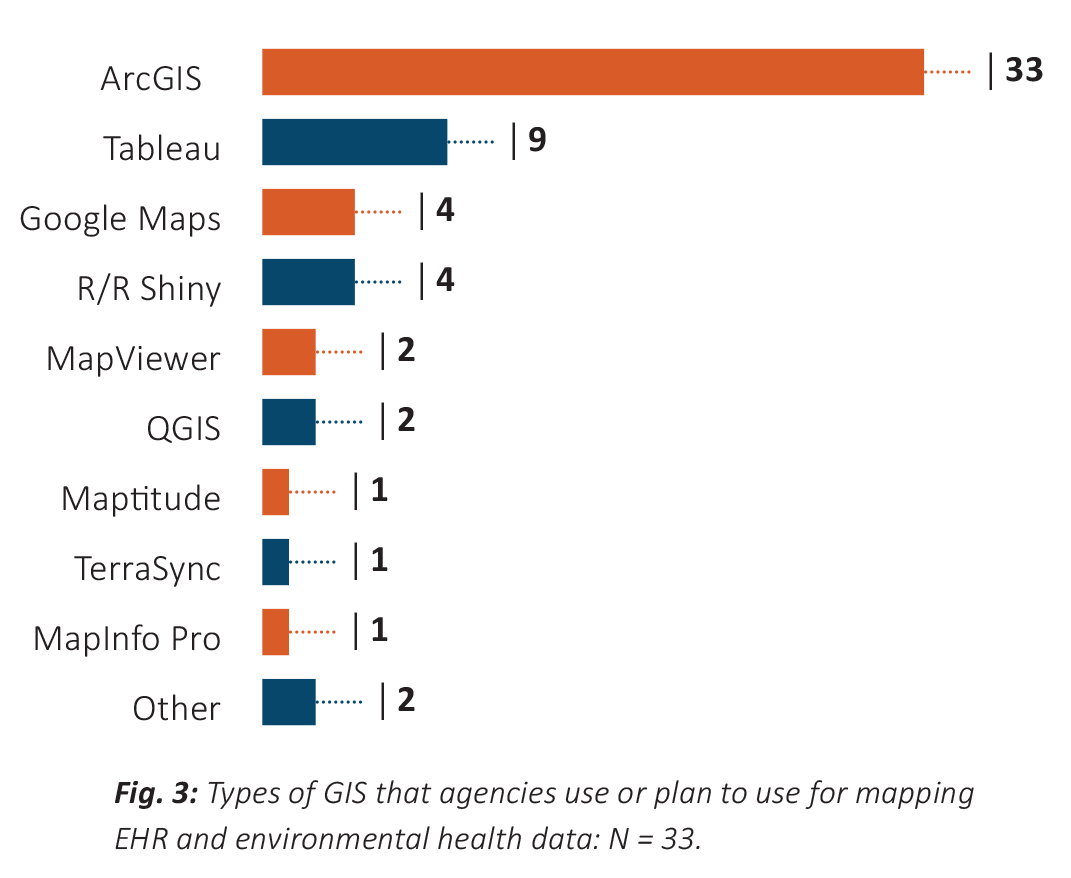 Most agencies are using ArcGIS for location-based mapping and analytics (Fig. 3).
1N refers to the total number of S/THAs that answered a survey question, unless otherwise indicated. AK’s response was from the state environmental agency, the Alaska Department of Environmental Conservation.